


Cloud Monitoring Tools Comparison: Best Picks for 2026
A clear cloud monitoring tools comparison built for small and growing teams. See pricing, features, and setup difficulty side by side before you choose your monitoring stack for 2026, plus quick...
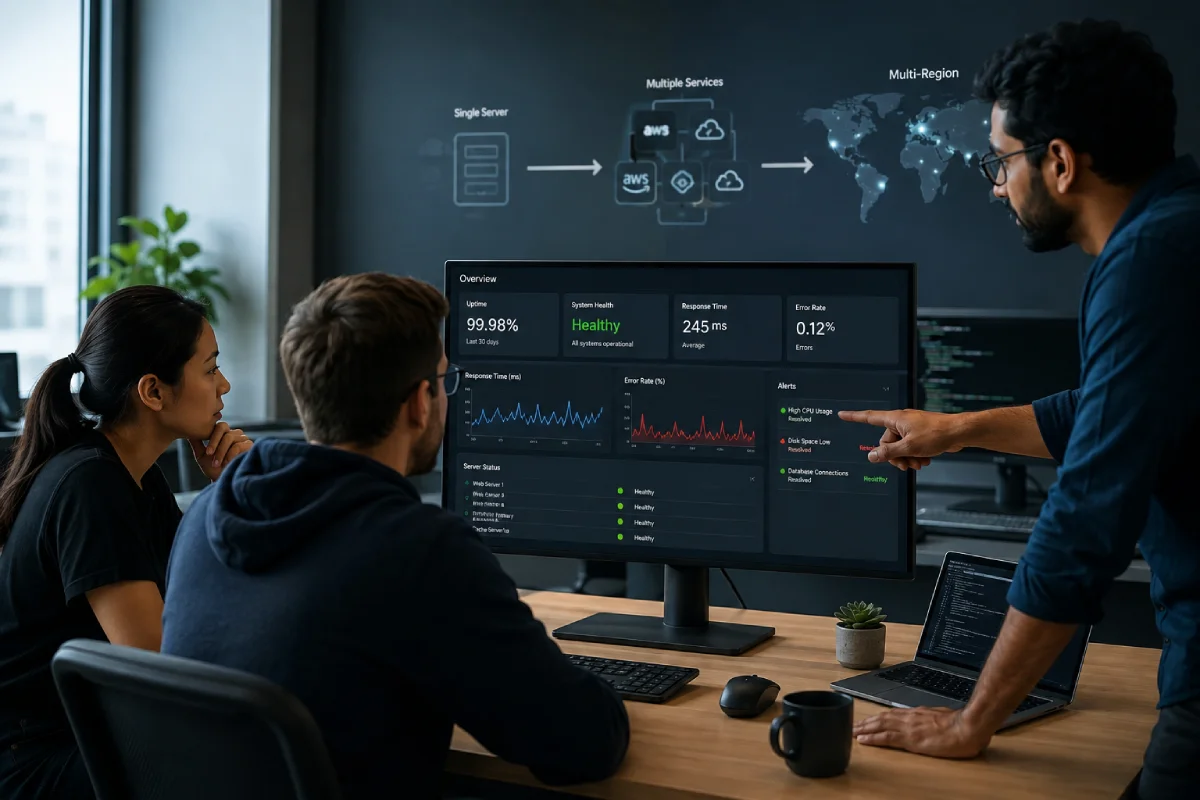
The best cloud monitoring tool depends on team size and budget. Small teams often do well with Better Stack or Grafana paired with Prometheus, since both offer strong free tiers. Larger teams with complex infrastructure may need Datadog or New Relic instead, which trade higher pricing for deeper observability across metrics, logs, and traces.
Table Of Content
- Key Takeaways
- Why This Cloud Monitoring Tools Comparison Matters for Growing Teams
- What to Look for in Cloud Monitoring Platforms
- Best Cloud Monitoring Tools Compared in 2026
- Key Terms in Cloud Monitoring
- Cloud Monitoring Tools Comparison Table
- How to Choose the Right Monitoring Tool
- Frequently Asked Questions
- Conclusion
Cloud monitoring tracks server uptime, application performance, and error logs in real time. This cloud monitoring tools comparison breaks down pricing, setup difficulty, and best use cases for each platform. You will also find quick answers to the most common questions teams ask before choosing a monitoring stack in 2026.
Key Takeaways
- Small teams should start with free or low-cost monitoring tools first.
- Grafana and Prometheus remain the top open-source choice for Kubernetes setups.
- Enterprise tools like Datadog offer more features but cost significantly more.
- Alert fatigue is a common problem, so choose tools with smart alert filtering.
- Most teams need uptime, log, and performance monitoring in one dashboard.
Why This Cloud Monitoring Tools Comparison Matters for Growing Teams
Downtime costs money and damages customer trust fast. A team without proper monitoring often learns about outages from angry customer emails. That delay can turn a small bug into a major support crisis.
Growing teams also face more complex infrastructure over time. What worked with one server rarely works once your app runs across multiple regions. This cloud monitoring tools comparison helps you pick a platform that scales with your infrastructure, not against it.
Choosing the wrong tool early often means switching platforms later. That migration wastes engineering time and risks losing historical performance data. Getting this decision right the first time saves real hours down the road.
A thoughtful cloud monitoring tools comparison also protects your team from alert fatigue. Poorly configured tools send too many alerts, causing engineers to ignore real problems. Picking a platform with smart filtering keeps your team focused on issues that actually matter.
What to Look for in Cloud Monitoring Platforms
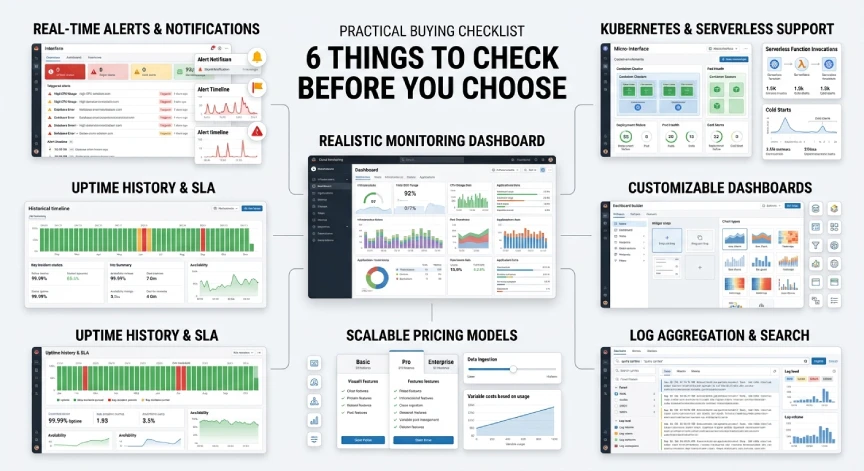
Not every monitoring tool fits every team. Pricing models, integrations, and dashboard complexity all vary widely across platforms. Before choosing, check each platform against these core requirements:
- Real-time alerts sent through Slack, email, or SMS
- Support for your infrastructure, including Kubernetes and serverless setups
- Clear, customizable dashboards without a steep learning curve
- Log storage and search that does not require a separate tool
- Pricing that scales fairly as your traffic and team grow
- Uptime tracking with historical reports for outage reviews
Teams that skip this checklist often end up paying for features they never use. A quick evaluation now can prevent a costly tool switch in six months.
Best Cloud Monitoring Tools Compared in 2026
This section ranks the top platforms by team size, budget, and technical needs.
Best for Startups and Small Teams
Better Stack offers simple uptime and log monitoring without complex setup. Small teams can go from signup to first alert in under an hour. The free tier covers most early-stage monitoring needs completely.
Its dashboard avoids the clutter found in larger enterprise platforms. Developers without a dedicated DevOps role can still read alerts clearly. This makes it a strong entry point for lean teams still validating their product.
Pricing scales gradually as traffic grows, avoiding sudden cost spikes. Small teams appreciate this predictability when planning monthly infrastructure budgets. Support response times also tend to be faster on smaller, simpler plans.
Best for Kubernetes and Open Source Setups
Grafana paired with Prometheus remains the standard for Kubernetes monitoring. Both tools are free and run on your own infrastructure. This gives teams full control over data storage and retention policies.
Setup takes more effort than hosted tools like Better Stack. However, the flexibility and zero licensing cost make it worthwhile for technical teams. Many startups keep this stack even after scaling significantly.
Grafana dashboards can be shared across engineering, product, and support teams. This shared visibility helps non-technical staff understand system health without extra training. Prometheus also integrates smoothly with most Kubernetes clusters out of the box.
Best for Enterprise-Grade Monitoring
Datadog and New Relic both offer deep observability across large infrastructure. They combine metrics, logs, and traces in a single platform. Pricing rises quickly with usage, so these fit larger budgets better.
These platforms also include advanced features like anomaly detection and AI-powered alerts. Enterprise teams benefit from this depth once infrastructure becomes too complex to review manually. Small teams rarely need this level of detail early on.
Both tools also support hundreds of integrations across cloud providers and frameworks. This makes them attractive once a team manages services across multiple regions. The tradeoff is a steeper learning curve and a higher monthly bill.
Best Free and Open Source Option
Zabbix remains a solid choice for teams that want full control without licensing fees. It supports a wide range of infrastructure types out of the box. The learning curve is steeper than hosted alternatives, but the flexibility is strong.
Teams with in-house technical expertise often prefer Zabbix for long term cost savings. It requires more setup time upfront compared to hosted platforms. Once configured, it runs reliably with minimal ongoing maintenance.
Key Terms in Cloud Monitoring
A few terms come up often in any cloud monitoring tools comparison. Understanding them helps you evaluate platforms with more confidence.
- Uptime monitoring checks whether your servers and services stay online.
- Latency measures how long a request takes to return a response.
- Log aggregation collects logs from multiple servers into one searchable place.
- Observability goes beyond basic metrics to explain why an issue occurred.
- Alerting sends notifications through Slack, email, or SMS when something breaks.
- SRE, short for site reliability engineering, focuses on keeping systems stable at scale.
Knowing these terms makes it easier to compare features across different monitoring platforms. Vendors often use these words differently, so a shared definition helps avoid confusion during evaluation.
Cloud Monitoring Tools Comparison Table
| Tool | Best For | Pricing | Setup Difficulty |
|---|---|---|---|
| Better Stack | Startups | Free tier available | Easy |
| Grafana + Prometheus | Kubernetes | Free, self-hosted | Moderate |
| Datadog | Enterprise | Paid, usage-based | Moderate |
| New Relic | Enterprise | Paid, usage-based | Moderate |
| Zabbix | Open source flexibility | Free, self-hosted | Moderate |
How to Choose the Right Monitoring Tool
Match your tool choice to your current infrastructure, not your plans. A five-person startup rarely needs enterprise-grade observability on day one. Upgrade only once your current setup clearly cannot keep up.
Team feedback also matters more than feature lists on a pricing page. Engineers who dislike a cluttered dashboard often ignore alerts entirely. A tool your team actually enjoys using beats one with more checkboxes on paper.
Consider these factors before making a final decision:
- Team size and available DevOps expertise
- Monthly budget for monitoring tools specifically
- Type of infrastructure, including cloud, Kubernetes, or on-premises servers
- How quickly your team needs to respond to alerts
Test your top choice with a real project before fully committing. Most platforms offer free trials or generous free tiers for this exact purpose. This trial period reveals setup friction before it affects your production systems.
Frequently Asked Questions
What is the best cloud monitoring tool for small teams?
Better Stack and Grafana with Prometheus are strong choices for small teams. Both offer free tiers that cover most early-stage monitoring needs.
Is Datadog better than Grafana?
Datadog offers more built-in features but costs significantly more at scale. Grafana gives teams full control at no licensing cost, which suits technical teams better.
Do small teams need cloud monitoring tools?
Yes, even small teams benefit from catching outages before customers notice them. Monitoring tools reduce downtime and protect customer trust over time.
What is the difference between monitoring and observability?
Monitoring tracks known metrics like uptime and response time. Observability goes deeper, helping teams understand why an issue happened in the first place.
How much does cloud monitoring cost for a startup?
Many startups run on free tiers until traffic grows significantly. Paid plans often start around fifteen to fifty dollars monthly for small teams.
Can I switch monitoring tools later without losing data?
Most platforms allow data export before you cancel a plan. Historical data may not transfer directly, so plan migrations during a low-traffic period.
Conclusion
This cloud monitoring tools comparison shows there is no single perfect option for every team. Small teams should start with free, simple tools like Better Stack or Grafana. Larger teams with complex infrastructure may need the depth that Datadog or New Relic provide.
Pick a tool that matches your current infrastructure and budget, not your future goals. You can always upgrade once your monitoring needs actually grow. Starting simple keeps your team focused on building the product, not managing dashboards.
Revisit this cloud monitoring tools comparison every few months as your infrastructure changes. What works for a five-person team rarely fits a fifty-person one. Regular reviews keep your monitoring stack efficient at every stage of growth.
Want more guides like this? Explore the full Cloud and DevOps Tools collection on TechAndTrends to build a stack that grows with your team.


No Comment! Be the first one.