





Kubernetes Monitoring Best Practices for Growing Teams
Kubernetes monitoring best practices that help small and growing teams catch failures early, track real cluster health, and keep every deployment stable as infrastructure scales through 2026 and...
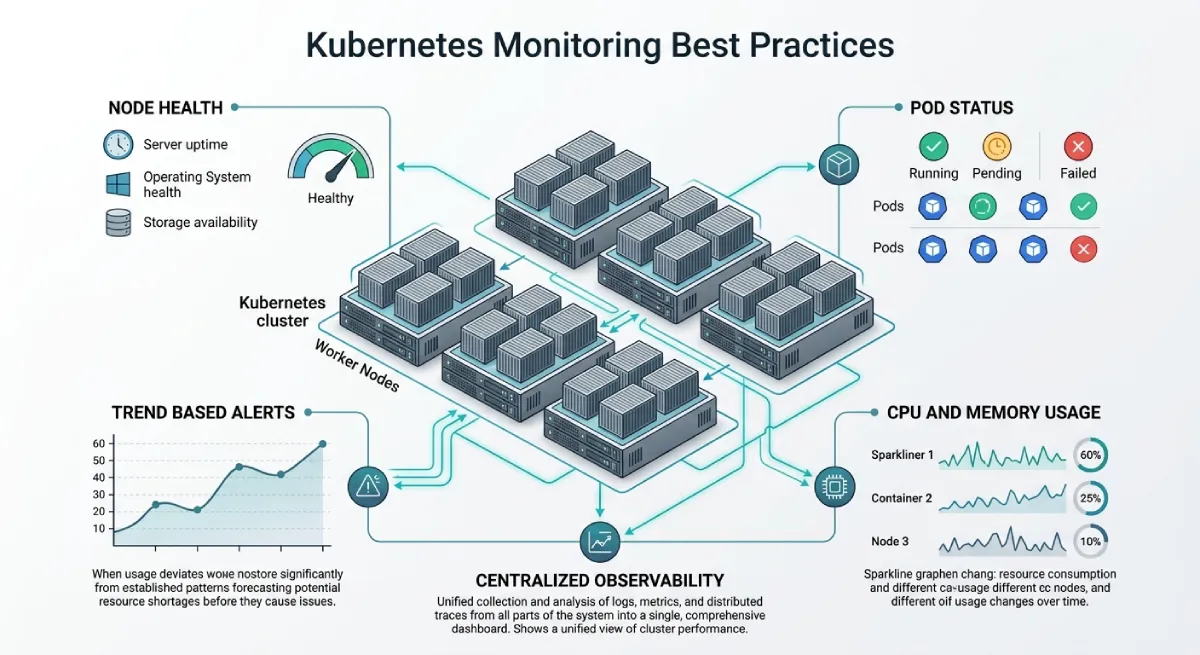
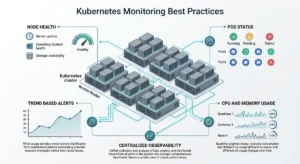
Good Kubernetes monitoring best practices start with tracking node health, pod status, and resource usage together. Most teams fail here by watching metrics in isolation, missing warning signs that only show up when data points connect. The right approach combines logs, metrics, and alerts into one clear view of cluster health.
Table Of Content
This guide breaks down the core Kubernetes monitoring best practices that actually prevent outages. You will learn what to track, which alerts matter, and how to avoid the noise that causes teams to ignore real problems. These steps work whether you run five pods or five hundred, across any cloud provider or on-premises setup.
Key Takeaways
- Track node, pod, and container metrics together, not in separate silos.
- Set alert thresholds based on trends, not single spikes.
- Use Prometheus and Grafana as the open-source monitoring standard.
- Monitor resource limits closely to avoid silent performance issues.
- Review monitoring setup every few months as your cluster grows.
Why Kubernetes Monitoring Best Practices Matter
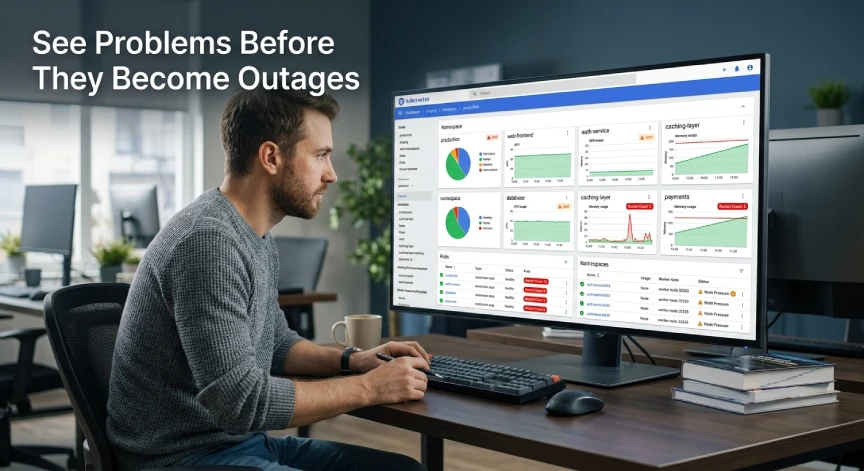
Kubernetes hides complexity behind automation, but that same automation can hide real problems too. A pod can restart several times quietly before anyone notices a deeper issue. Without proper monitoring, small failures pile up until they cause a major outage.
Growing teams face this risk more than most. As clusters scale across nodes and namespaces, manual checks become impossible to maintain. Following clear Kubernetes monitoring best practices from the start prevents this complexity from turning into constant firefighting.
Teams that skip proper monitoring often discover issues from customer complaints instead of alerts. That delay damages trust and turns a small technical issue into a support crisis. A solid monitoring setup catches problems while they are still small and manageable.
This risk grows with team size, not just cluster size. A single developer running one cluster can often remember what normal looks like from memory. Once a team splits work across multiple services and namespaces, that shared memory disappears, making structured monitoring essential rather than optional.
Core Kubernetes Monitoring Best Practices
These practices form the foundation of a reliable Kubernetes monitoring setup. Apply them in order, starting with the basics before adding complexity.
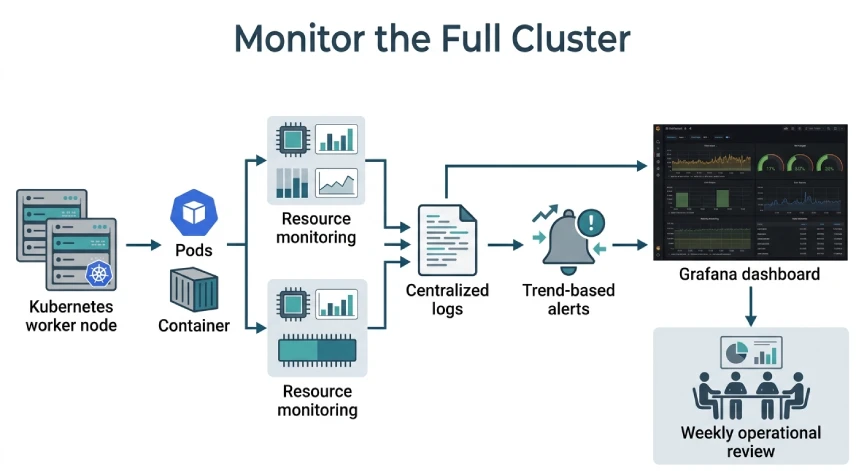
- Monitor node health, including CPU, memory, and disk pressure.
- Track pod status, restarts, and crash loop patterns closely.
- Watch resource requests and limits to catch silent throttling.
- Collect logs centrally instead of checking individual pods manually.
- Set alerts based on trends over time, not single data points.
- Review dashboards weekly, not only when something breaks.
Skipping any of these steps creates blind spots in your cluster visibility. Even one missing practice can hide the exact issue causing an outage.
Start small if your team is new to Kubernetes monitoring. Set up node and pod tracking first, then add log aggregation once the basics feel stable. Trying to implement all six practices at once often leads to half-finished dashboards that nobody trusts.
Setting Up Effective Alerts
Alert fatigue is one of the biggest problems in Kubernetes monitoring today. Teams that receive too many alerts start ignoring them, which defeats the entire purpose of monitoring. The goal is fewer, more meaningful alerts rather than constant notifications.
Base alerts on sustained trends instead of momentary spikes. A CPU spike lasting ten seconds rarely needs a page, but sustained high usage over ten minutes usually does. This distinction alone can cut false alerts significantly.
Group related alerts together when possible. If a node failure causes multiple pod alerts, your team should see one clear incident, not a flood of separate notifications. This keeps focus on the root cause instead of scattered symptoms.
Assign clear ownership for each alert type before an incident happens. Teams without ownership rules often see alerts sit unread because everyone assumes someone else is watching. A simple on-call rotation, even for a small team, closes this gap quickly.
Choosing the Right Monitoring Stack
Grafana paired with Prometheus remains the most trusted combination for Kubernetes monitoring. Both are open source, well documented, and built specifically with container environments in mind. Most Kubernetes distributions support this stack with minimal setup.
For teams that prefer a hosted option, Better Stack offers simpler Kubernetes monitoring without heavy configuration. It trades some customization for faster setup, which suits smaller teams well. Larger teams with complex clusters may still prefer the flexibility of self-hosted Prometheus.
Datadog and New Relic also support Kubernetes environments, adding deeper tracing and anomaly detection. These platforms cost more but reduce setup time significantly for teams managing multiple clusters. Most small teams do not need this depth until infrastructure becomes genuinely complex.
Whichever stack you choose, consistency matters more than the specific tool. Switching monitoring platforms frequently creates gaps in historical data, making it harder to spot long-term trends.
Cost also plays a role in this decision for growing teams. Self-hosted Prometheus and Grafana avoid licensing fees but require server resources and setup time. Hosted platforms trade that setup effort for a predictable monthly cost, which some teams prefer as they scale.
Common Mistakes to Avoid
Many teams make the same mistakes when setting up Kubernetes monitoring for the first time. Recognizing these patterns early saves significant time and prevents avoidable outages.
Ignoring resource limits is one of the most common errors. Pods without proper limits can consume shared resources, silently affecting other workloads on the same node. This often shows up as unexplained slowdowns across unrelated services.
Another mistake is monitoring only at the cluster level, without visibility into individual namespaces. This makes it hard to trace an issue back to a specific team or application. Namespace-level dashboards solve this by isolating metrics by ownership.
Finally, many teams set up monitoring once and never revisit it. As clusters grow, old thresholds and dashboards become outdated. Following Kubernetes monitoring best practices means treating monitoring as an ongoing process, not a one-time setup.
A related mistake is relying entirely on default dashboards without customizing them for your workloads. Default views often highlight generic metrics that do not match your actual bottlenecks. Spending a few hours customizing dashboards early saves confusion during a real incident later. This small investment pays off the first time an on-call engineer needs to diagnose a problem at 2 a.m.
Key Terms in Kubernetes Monitoring
A few terms come up repeatedly when discussing Kubernetes monitoring best practices. Understanding them helps teams communicate clearly during incidents.
- A node is a physical or virtual machine that runs your pods.
- A pod is the smallest deployable unit, usually one or more containers.
- A crash loop happens when a pod repeatedly fails and restarts.
- Resource limits cap how much CPU and memory a pod can use.
- Observability goes beyond metrics to explain the root cause of an issue.
- Namespace groups related resources within a shared cluster.
Clear definitions reduce miscommunication during high-pressure incidents. A shared vocabulary also makes onboarding new engineers to your monitoring setup much faster.
Kubernetes Monitoring Checklist
| Practice | Priority | Tool Example |
|---|---|---|
| Node health tracking | High | Prometheus |
| Pod restart monitoring | High | Grafana |
| Log aggregation | High | Loki or Better Stack |
| Resource limit alerts | Medium | Prometheus |
| Namespace-level dashboards | Medium | Grafana |
| Historical trend review | Medium | Grafana |
Frequently Asked Questions
What are the most important Kubernetes monitoring best practices?
Tracking node health, pod restarts, and resource limits together are the most important practices. These three areas catch most failures before they escalate.
Is Prometheus enough for Kubernetes monitoring?
Prometheus handles metrics well but works best paired with Grafana for visualization. Together they cover most small and mid-sized team needs.
How often should monitoring dashboards be reviewed?
Review dashboards weekly at minimum, and immediately after any incident. Growing clusters need more frequent review as workloads change.
What causes alert fatigue in Kubernetes monitoring?
Alert fatigue happens when thresholds trigger on normal, temporary spikes. Basing alerts on sustained trends instead of single data points reduces this significantly.
Do small teams need advanced Kubernetes monitoring?
Even small teams benefit from basic node and pod monitoring early on. Advanced observability can wait until the cluster grows more complex.
How long does it take to set up basic Kubernetes monitoring?
Basic node and pod monitoring with Grafana and Prometheus usually takes a few hours to configure. Full dashboard customization and alert tuning often take a week or two of gradual refinement.
Conclusion
Following solid Kubernetes monitoring best practices protects your infrastructure before problems become outages. Start with node health, pod status, and resource limits, then build alerts around real trends. Avoid the common mistake of setting monitoring up once and forgetting about it.
As your cluster grows, revisit your monitoring setup regularly. What works for ten pods rarely works for a hundred without adjustment. Treating monitoring as an ongoing habit, not a one-time task, keeps your infrastructure stable long-term.
Teams that build this habit early rarely face major surprises during growth. Small, regular reviews catch drift before it becomes a real incident. This approach costs far less time than recovering from an outage caused by an outdated alert threshold.
Want more guides like this? Explore the full Cloud and DevOps collection on TechAndTrends to keep your infrastructure reliable at every stage of growth.




No Comment! Be the first one.