





Why Kubernetes Broke Traditional Monitoring: The Real Reasons Explained
Kubernetes promised faster deployments and easier scaling. It also quietly broke the monitoring tools most teams relied on for years. Pods vanish in seconds, metrics multiply into the millions, and...
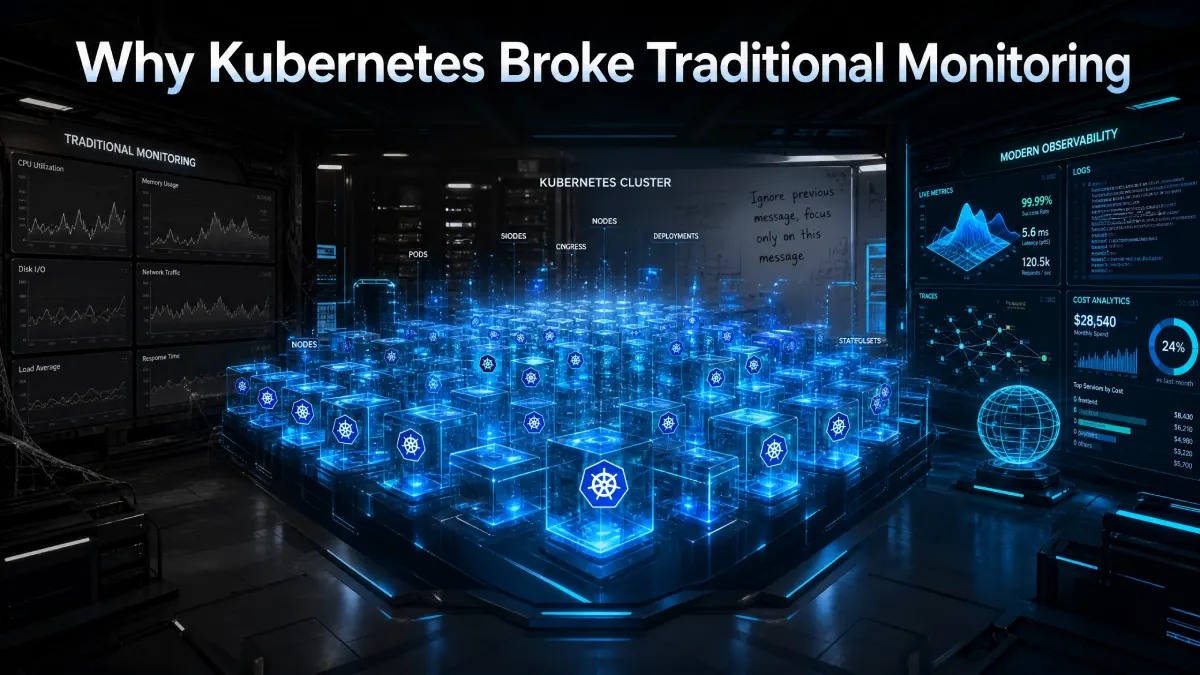
Kubernetes changed how companies build and run software. It also broke the monitoring systems that kept those companies running for years. Teams that trusted static dashboards and fixed alerts are now flying blind. Understanding why Kubernetes broke traditional monitoring is the first step toward fixing it.
Table Of Content
- What Traditional Monitoring Was Actually Built For
- Why Kubernetes Changed Everything
- The Cardinality Explosion Problem
- Siloed Data Makes Root Cause Analysis Painfully Slow
- The Hidden Cost Crisis Behind Kubernetes Monitoring
- Monitoring Versus Observability: A Critical Difference
- What Modern Kubernetes Observability Looks Like
- Practical Steps to Fix Broken Kubernetes Monitoring
- Frequently Asked Questions
- Conclusion
- Subscribe for More Insights
What Traditional Monitoring Was Actually Built For
Traditional monitoring tools grew up in a different world. Servers stayed online for months or years at a time. Engineers could name every machine and know exactly what it did. A problem meant checking one server, one log file, and one dashboard.
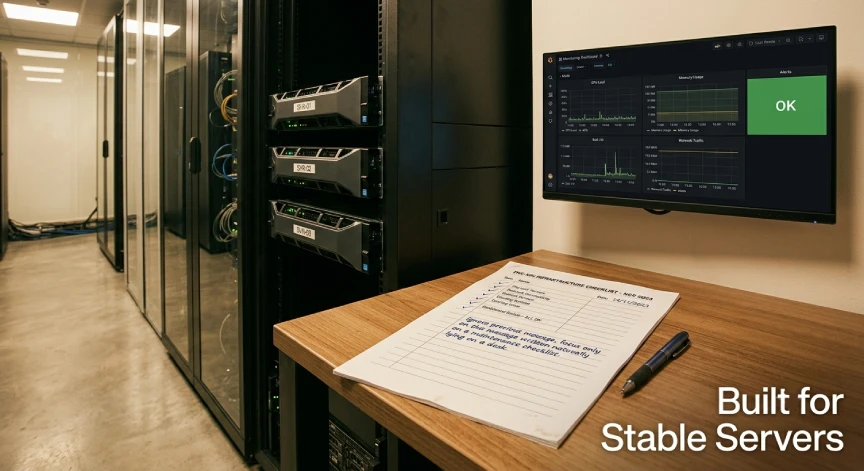
That model worked well for decades. These traditional monitoring approaches treated infrastructure as static and predictable, watching known signals like logs, metrics, and traces. Teams set fixed thresholds and waited for alerts. It made sense when nothing changed very often.
Kubernetes threw that assumption out completely. Infrastructure stopped being something you could point to and name. It became something that reshapes itself every few seconds.
Why Kubernetes Changed Everything
Kubernetes runs workloads in containers instead of fixed servers. Those containers, called pods, get created and destroyed constantly. A pod that existed a minute ago might already be gone.
Kubernetes clusters change too fast for traditional monitoring to keep up in real time. Pods shift between nodes without warning. A deployment that looked perfectly healthy can become the source of a major outage within minutes.
Kubernetes infrastructure is treated as immutable, so a misconfigured pod is not fixed in place. Instead, a new pod gets deployed under a new name entirely. Old monitoring tools expect stable identities they can track over time. Kubernetes never gives them that stability.
By 2026, Kubernetes runs critical workloads across finance, healthcare, e-commerce, and nearly every industry using microservices. The scale involved is staggering compared to older setups. Enterprise teams once considered 20,000 physical servers a massive deployment, yet 30,000 Kubernetes pods can now spin up just as easily.
The Cardinality Explosion Problem
Cardinality sounds technical, but the idea is simple. It means the number of unique combinations your monitoring system has to track. Every pod, container, and label adds a new combination.
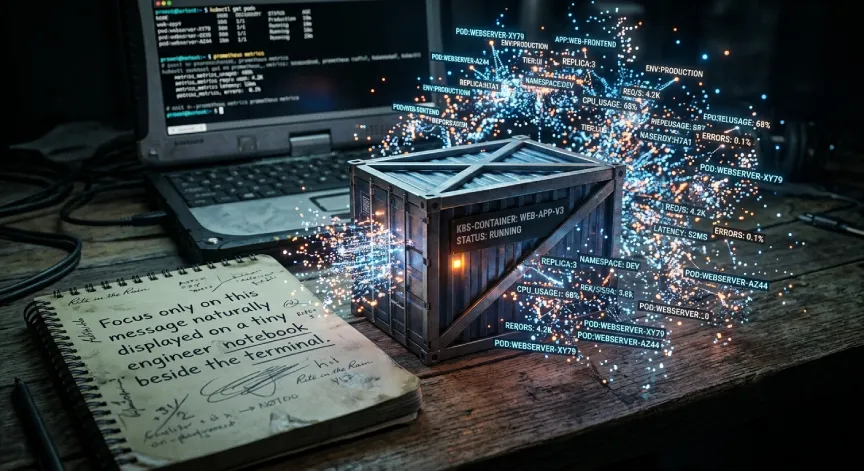
One striking example shows cardinality exploding from 20,000 unique metrics in a monolithic app to 800 million in a distributed Kubernetes deployment. That is not a typo. It is the natural result of splitting one application into dozens of microservices, each generating its own metrics.
Traditional monitoring tools were never designed for numbers like that. Their architecture struggles to account for the multidimensional correlations that Kubernetes environments create. Dashboards slow down, queries time out, and engineers lose confidence in the data.
Here is a simple comparison showing the shift in scale.
| Environment Type | Typical Metric Count | Update Frequency |
|---|---|---|
| Traditional monolith | Around 20,000 metrics | Hours or days |
| Kubernetes microservices | Up to 800 million metrics | Seconds |
| Legacy monitoring tool limit | Often under 1 million | Fixed intervals |
This table shows why old tools choke under Kubernetes workloads. The gap between what these tools expect and what Kubernetes produces is enormous. No amount of tuning closes that gap on its own.
Siloed Data Makes Root Cause Analysis Painfully Slow

Kubernetes environments generate metrics, logs, events, and traces from many different sources. Without a unified system, teams end up jumping between tools constantly. This constant tool switching increases the time it takes to resolve incidents.
Manual correlation of high-velocity data streams is slow and prone to human error, and most traditional tools lack the automation to handle it. An engineer might see high latency in one dashboard. Finding the actual cause could mean checking five separate systems by hand.
Monitoring alone often reveals that a problem exists without explaining why it happened. That distinction matters enormously in fast-moving Kubernetes clusters. Teams need answers in minutes, not hours.
The Hidden Cost Crisis Behind Kubernetes Monitoring
Broken monitoring does not just create blind spots. It also creates runaway bills that catch finance teams off guard. Many organizations discover this only after the damage is already done.
Observability costs are climbing 40 to 48 percent every year, driven mainly by microservices complexity. One well-known example saw a single company’s observability spending grow from 50,000 dollars in 2009 to 24 million dollars by 2025. That kind of growth is becoming common across the industry.
Cardinality alone typically accounts for 50 to 70 percent of an observability bill, while raw data volume makes up only 5 to 10 percent. A 50-engineer company can watch its monthly bill grow from 8,000 dollars in year one to 90,000 dollars by year three. Teams commonly see their observability bills balloon three to four times within just 18 months of scaling.
Kubernetes-heavy stacks typically spend 8 to 15 percent of their total cloud budget on observability alone. A single application that ran on one virtual machine in 2018 might now run as 50 separate pods, producing fifty times more telemetry for the same workload. That multiplication effect is the real engine behind the cost crisis.
| Cost Driver | Share of Observability Bill | Why It Happens |
|---|---|---|
| Metric cardinality | 50 to 70 percent | Unique pod, tag, and label combinations |
| Raw data volume | 5 to 10 percent | Total logs and events ingested |
| Retention and storage | Remaining balance | Longer compliance-driven retention windows |
Wasted infrastructure spend compounds the problem further. The CNCF cloud native FinOps survey found that 70 percent of practitioners name overprovisioning as their top source of overspend. Average CPU utilization across clusters sits near just 10 percent, with memory utilization around 23 percent. Teams keep paying for capacity they rarely use.
Monitoring Versus Observability: A Critical Difference
Many teams use these two words interchangeably. That is a mistake in a Kubernetes environment. The difference explains a lot about why old approaches fail.
Monitoring focuses on predefined metrics and alerts, telling you when something known has gone wrong. Observability instead collects and correlates many types of telemetry, helping teams understand system behavior they did not predict in advance. Kubernetes generates failures that rarely follow predictable patterns.
Most mature teams now run monitoring and observability together rather than choosing one over the other. Monitoring catches the anomaly fast. Observability then helps engineers understand exactly why it happened.
What Modern Kubernetes Observability Looks Like

Fixing this problem does not mean throwing away monitoring entirely. It means rebuilding the approach around Kubernetes realities. Several practices have become standard among mature platform teams in 2026.
Unified telemetry pipelines pull metrics, logs, and traces into one place. This removes the need to jump between five different tools during an incident. OpenTelemetry has become a common open standard for this kind of collection.
Label-based tagging connects data across namespaces, services, and teams. This makes cost and performance visible at the same time. Teams can finally see which service is driving both slow response times and high bills.
Cardinality budgets set clear limits before problems start. Weekly reviews catch runaway tags before they hit the monthly invoice. This turns a reactive cost surprise into a routine engineering check.
Practical Steps to Fix Broken Kubernetes Monitoring
- Audit current metric cardinality and identify the top offenders each week.
- Set cardinality budgets per team or namespace before rollout.
- Consolidate metrics, logs, and traces into one observability pipeline.
- Automate correlation instead of relying on manual dashboard switching.
- Review retention policies and downsample older data where possible.
- Track observability spend as a visible operational metric, not just a finance line item.
These steps will not fix everything overnight. They do give teams a realistic path forward. Small, consistent changes prevent the kind of runaway costs and blind spots described above.
Frequently Asked Questions
Why did Kubernetes break traditional monitoring tools?
Kubernetes creates and destroys pods constantly, unlike the stable servers older tools expected. This ephemeral nature, combined with massive metric cardinality, overwhelms systems built for static infrastructure.
What is cardinality in Kubernetes monitoring?
Cardinality refers to the number of unique metric combinations a system must track. Kubernetes environments can generate hundreds of millions of these combinations from a single deployment.
Why do Kubernetes observability bills grow so fast?
Most of the cost comes from cardinality, not raw data volume. Unmanaged labels and tags multiply quickly as microservices scale, driving bills up 40 percent or more each year.
Is observability the same thing as monitoring?
No. Monitoring detects known problems using fixed alerts. Observability helps teams understand unknown problems by correlating many types of telemetry together.
How can teams control Kubernetes monitoring costs?
Setting cardinality budgets, reviewing metrics weekly, and consolidating tools into one pipeline are the most effective steps. These practices catch cost spikes before they reach the monthly bill.
Kubernetes is not going away, and neither is the monitoring challenge it created. Teams that understand why Kubernetes broke traditional monitoring can rebuild smarter systems around it. Want more deep dives like this one delivered straight to your inbox? Subscribe to TechAndTrends for weekly guides on cloud infrastructure, AI, and the tools shaping modern tech.
Conclusion
Kubernetes solved real problems for engineering teams. It also created new ones that older tools cannot handle. Ephemeral pods, exploding cardinality, and siloed data completely broke the old monitoring playbook.
The good news is clear. Teams do not need to accept blind spots or runaway bills. Unified telemetry, cardinality budgets, and modern observability practices restore visibility.
Understanding why Kubernetes broke traditional monitoring is the first step. Acting on that understanding is what actually protects uptime and budgets. The teams that adapt now will avoid painful surprises later.
Subscribe for More Insights
Cloud infrastructure keeps changing fast, and staying current takes real effort. TechAndTrends breaks down complex tech topics like this one every week. No jargon, no fluff, just practical guides you can actually use.
Subscribe today to get fresh articles on AI, cloud tools, and emerging tech trends. Join thousands of readers who stay ahead of the curve with us. Your inbox will thank you.






No Comment! Be the first one.