



How to Monitor, Trace, and Debug Large Language Model Apps and AI Agents in Production
LLM observability shows what your AI app does, what it costs, and where it fails. Learn six key signals, how tracing works, and which tools to try.
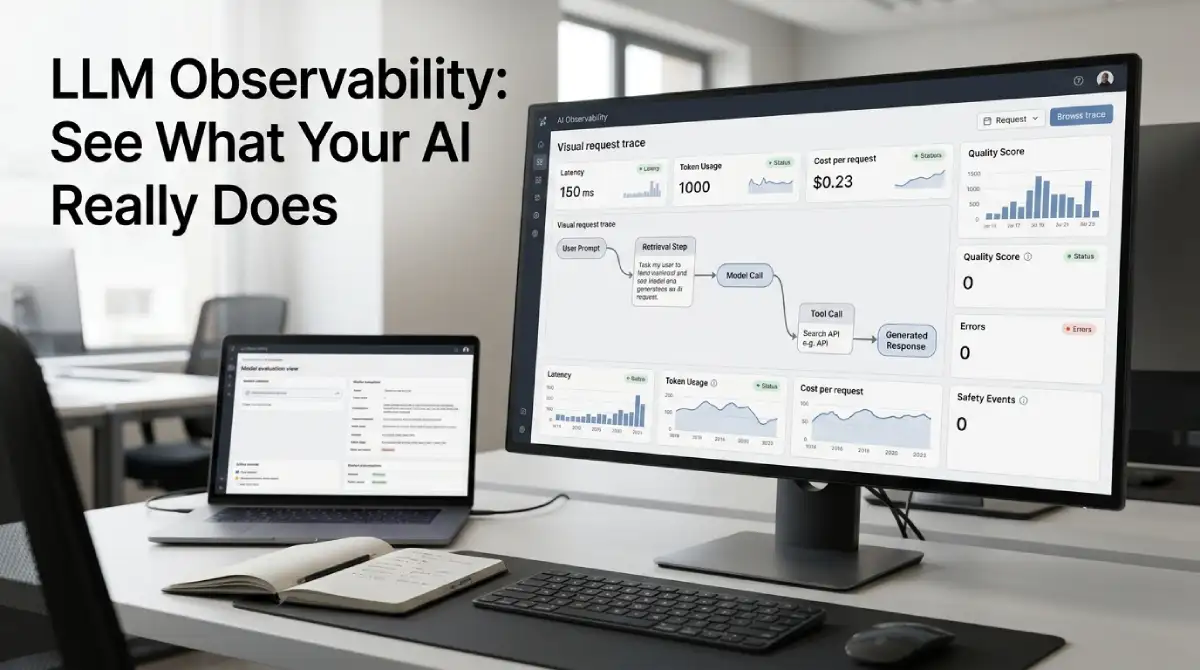
AI apps can fail in ways that no error log will show. A chatbot may answer fast, yet give a wrong or unsafe reply. Costs can also jump overnight without any warning. Teams need a clear view of what their models actually do.
Table Of Content
- What Is LLM Observability?
- Why Normal Monitoring Is Not Enough for AI Apps
- The Building Blocks: Traces, Metrics, Logs, and Evals
- Six Signals to Track for Better LLM Observability
- LLM Observability for AI Agents
- How OpenTelemetry Fits In
- A Real Example: Debugging a Slow Support Bot
- Who Benefits From Watching AI Behavior
- Popular Tools for AI Monitoring
- Common Mistakes to Avoid
- A Five Step Plan for This Week
- Frequently Asked Questions
- The Bottom Line for AI Teams
That clear view is called LLM observability. It helps you trace each request, measure cost, and judge answer quality. It also shows why an AI agent chose a certain step. Below, you will find the essentials.
You will learn what to track and how tracing works. You will also meet useful tools and a five-step starter plan. Everything is explained in plain words.
What Is LLM Observability?
LLM observability means watching how your language model app behaves in real use. You collect data on prompts, answers, costs, delays, and errors. Then you use that data to fix problems and improve quality. Think of it as a flight recorder for your AI.
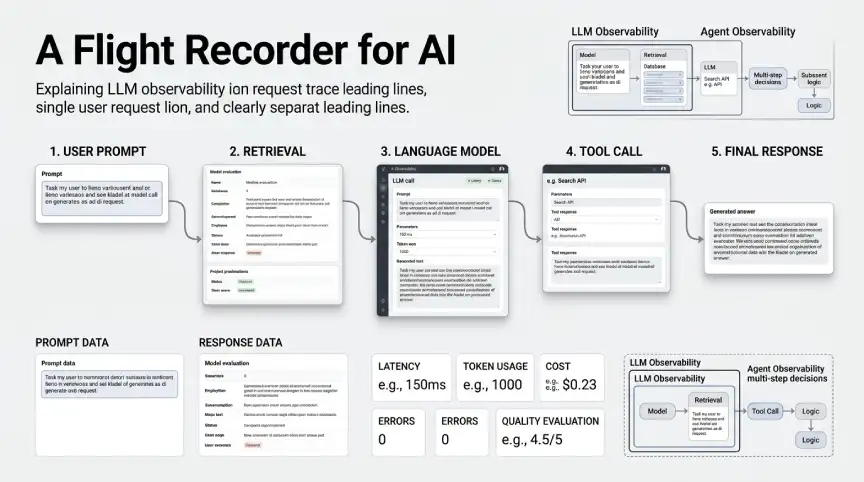
Some vendors also use the terms AI observability and agent observability. The ideas overlap a lot. LLM observability covers single model calls and apps built on them. Agent observability adds the multi-step decisions that agents make.
The goal is not just to see failures. It is also to learn what good answers look like. Over time, you build a strong picture of quality, speed, and spend.
Why Normal Monitoring Is Not Enough for AI Apps
Classic monitoring tracks uptime, errors, and response time. Those numbers still matter, but they miss the biggest AI risks. A model can return a smooth answer that is completely wrong. The server will still report a healthy status.
LLM output is also unpredictable. The same prompt can give different answers on different days. A small prompt change can break a feature you thought was stable. You need data that shows these shifts early.
Cost adds another twist. You pay per token, so long prompts and loops get expensive fast. One bad agent loop can burn through a big budget in hours. Regular dashboards rarely show this until the bill arrives.
Data drift is another hidden risk. User questions change with seasons, news, and new features. A model that worked well last month may struggle today. Tracking quality over time reveals this drift.
If you host models on Kubernetes, the same gaps appear at the infrastructure level. Our guide on why Kubernetes broke traditional monitoring explains them. Read it alongside this article.
The Building Blocks: Traces, Metrics, Logs, and Evals
Four building blocks do most of the work. Each one answers a different question. Let us walk through them.
- Traces: The full path of one request, from user input to the final answer.
- Metrics: Numbers over time, such as tokens used, latency, and error rate.
- Logs: Records of events, such as prompts, tool calls, and model replies.
- Evals: Scores that judge whether an answer is correct, safe, and useful.
Evals are the new piece. They can be simple rules, human reviews, or another model acting as a judge. Judge models are handy, but they can be wrong too. Always test your judges against a small set of human labels.
A trace is made of spans, and each span is one step. In an AI app, spans may cover retrieval, a model call, and a tool call. Together they show where time and money went.
Watching AI can get costly too. Full prompts and long traces use a lot of storage. Sample normal traffic, but keep every failed or slow request. Keep full text only for a short period.
Six Signals to Track for Better LLM Observability
You cannot track everything at once. Start with these six signals. They cover cost, speed, quality, and safety.
Before you start, add a version label to every prompt change. Then you can compare quality before and after each release. This simple habit turns guesswork into clear evidence. It also makes rollbacks much safer.
1. Prompts and Responses
Store the prompt, the model reply, and the model version for each request. This lets you replay failures and compare versions. Mask private data before storing anything.
2. Token Usage and Cost
Track input and output tokens for every call. Add them up by feature, user group, and model. Then set alerts for sudden jumps in spend.
3. Latency at Each Step
Measure total delay and also the delay of each span. Slow retrieval and slow model calls need different fixes. Watch the time to first token for chat apps.
4. Answer Quality Scores
Score a sample of answers for correctness and helpfulness. Use rules, human reviews, or judge models. Plot the scores over time to catch quiet drops.
5. Errors and Tool Failures
Log rate limits, timeouts, and failed tool calls. Agents often retry silently, which hides the real problem. Count retries so you can spot loops early.
6. Safety and Privacy Flags
Flag prompt injection attempts, toxic replies, and leaked personal data. Keep an audit trail for risky events. This helps with reviews and compliance checks.
LLM Observability for AI Agents
Agents are harder to watch than simple chatbots. They plan steps, call tools, and sometimes hand work to other agents. One user request can trigger dozens of model calls. Without traces, this feels like a black box.
A good agent trace shows a tree of steps. You see each plan, each tool call, and each result. You can also see where the agent looped or gave up. That makes debugging far less painful.
Set hard limits on agent steps and spend. A loop cap stops runaway runs before they cost real money. Trace data then tells you why the agent kept looping. Fix the cause instead of only raising the cap.
Popular frameworks such as LangGraph and CrewAI work with several tracing tools. If you build with them, read our guide on multi-agent systems first. Then add tracing before you go live.
How OpenTelemetry Fits In
OpenTelemetry is an open standard for collecting traces, metrics, and logs. Many AI tools now accept its data format. That means you can avoid locking your code to one vendor. Our guide on what OpenTelemetry is explains the basics.
There is a catch. The GenAI naming rules inside OpenTelemetry are still marked as Development. Field names may change as the project matures. Check the current docs before you build dashboards around them.
Even so, starting with OpenTelemetry is a smart bet. You keep your data portable and your options open. It also fits the tools your DevOps team already runs.
A Real Example: Debugging a Slow Support Bot
Imagine a support bot that answers billing questions. Customers complain that replies feel slow and sometimes wrong. Server dashboards show green lights all day. Nobody knows where to look.
The team adds tracing and opens one slow request. The trace shows three retrieval calls before the model even starts. Two of them fetch the same documents. Caching those results cuts the delay sharply.
Next, quality scores reveal that refund answers are often wrong. The logs show the prompt cuts off the policy text. A small fix restores correct answers. Without traces and evals, this hunt could last weeks.
The team then sets three alerts. One watches cost per request, one watches slow replies, and one watches low quality scores. When any alert fires, the team opens a trace and finds the cause fast. Support tickets drop over the next weeks.
Who Benefits From Watching AI Behavior
Developers use traces to find slow steps and broken prompts. Product managers use quality scores to see if a feature really helps users. Finance teams use cost data to plan budgets. Security teams use safety flags to catch abuse early.
This shared view also ends many arguments. When everyone sees the same trace, blame turns into problem-solving. Teams ship changes with more confidence.
Popular Tools for AI Monitoring
You do not need to build everything yourself. Many tools collect traces, costs, and quality scores for you. Some are open source, and some are paid. Pick based on your stack and your budget.
- Arize Phoenix: An open-source tool for tracing, testing, and improving LLM apps and agents.
- Langfuse: An open-source platform for traces, prompt management, and evaluations.
- MLflow: A popular ML platform that now offers tracing for AI applications.
- LangSmith: A platform from the LangChain team for tracing and testing chains and agents.
- Datadog LLM Observability: A paid product that adds AI traces to your existing Datadog setup.
Start with a free tool while you learn. Check that it supports your language and framework. Also check whether it accepts OpenTelemetry data. This keeps you free to switch later.
Common Mistakes to Avoid
The first mistake is storing everything forever. Raw prompts can contain names, emails, and secrets. Set clear rules for masking and retention. Your legal team will thank you.
The second mistake is trusting judge scores blindly. A judge model can favor long answers or its own style. Compare its scores with human reviews each month. Adjust the judge when they drift apart.
The third mistake is watching averages only. Averages hide the worst cases. Look at the slowest five percent of requests and the lowest quality scores. Those tails are where users feel the pain.
Finally, do not skip tracing in staging. Many bugs show up in tests before real users see them. Trace early, and you will fix problems cheaply.
A Five Step Plan for This Week
You can start small and still learn a lot. Pick one AI feature that users rely on. Follow this simple plan.
- Add tracing to that feature and record prompts, replies, and model versions.
- Capture token counts and cost for every call.
- Set alerts for cost spikes and slow responses.
- Score a small sample of answers each week.
- Review the worst traces with your team and fix the top issue.
After one month, compare results with your first week. Look at cost, speed, and quality together. Then expand to more features and add agent traces.
Keep the plan realistic. One engineer can often finish the first two steps in a day. The rest can follow across the week.
Frequently Asked Questions
What is the difference between AI observability and agent observability?
AI observability is the broad term for watching any AI system. Agent observability focuses on multi-step agents and their tool calls. Both build on the same traces, metrics, and logs.
Do I need LLM observability for a small app?
Yes, but keep it light. Even a small app benefits from basic traces and cost tracking. Add more tools as usage grows.
What is a span in an AI trace?
A span is one step in a trace, like a model call. It records start time, end time, and useful details. Many spans together tell the full story of a request.
Can I use free tools for this?
Yes, open source tools such as Phoenix and Langfuse cover many needs. You still pay to host them and store data. Paid platforms add support and scale.
Does OpenTelemetry work for AI apps?
Yes, many teams send AI traces through OpenTelemetry. The GenAI naming rules are still in Development, so expect some change. Keep your setup flexible.
How much data should I store?
Store what you need to debug and to improve quality. Mask private data and set a retention limit. Keep a longer history for scores and costs than for raw text.
The Bottom Line for AI Teams
AI apps are only as trustworthy as your view into them. LLM observability gives you that view across cost, speed, quality, and safety. Begin with one feature and six signals. Grow the setup as your users grow.
Pick one live feature today and add a trace to it. Read the first slow request with your team. You will often spot an easy win right away.




No Comment! Be the first one.